
Anatomy of Fraud Investigation and Detection - Part 2
Continuing on how to determine financial fraud, here we will talk about mechanisms recommended to detect financial fraud through analysing financial statements.
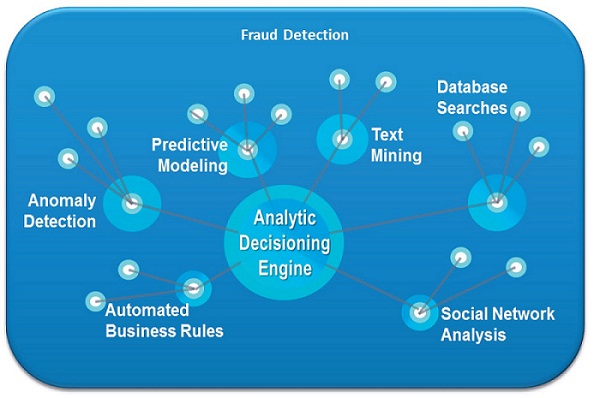
Techniques to detect corporate fraud
Some of the most commonly used mechanisms to detect fraud are listed below:
Benford’s law
According to Benford’s Law in normal corporate financials naturally occurring collection of numbers, the leading significant digit is likely to be small.
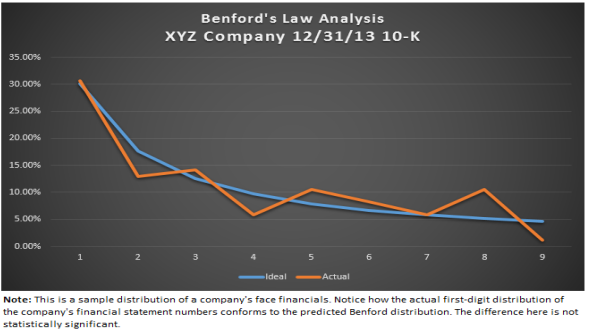
As in the above graph digit 8 is significantly above benford law curve, we may need to do a further investigation to detect fraud.
While Benford’s Law should not be used as a decision making tool by itself, it may prove to be a useful screening tool to indicate that a set of financial statements deserves a deeper analysis.
Altman’s Z score
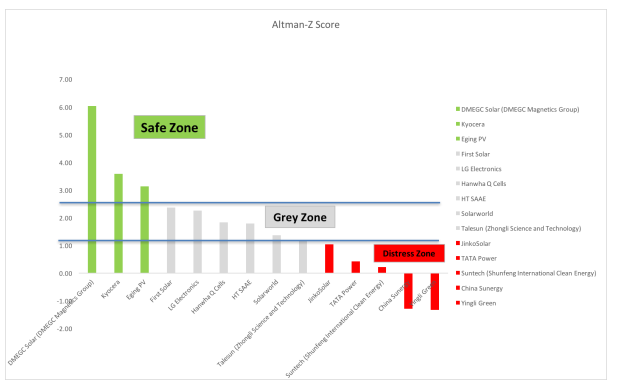
Altman Z Score has been traditionally used to predict possible bankruptcy or financial distress for a corporate entity. The Z Score formula is as follows
Z=1.2X1 + 1.4X2 + 3.3X3 + 0.6X4 + 1.0X5
X1= working capital / total assets. Measures of liquid assets in relation to the size of the company.
X2= retained earnings / total assets. Measures of profitability that reflects the company’s age and earning power.
X3= earnings before interest and taxes / total assets. Measures operating efficiency apart from tax and leveraging factors. It recognizes operating earnings as being important to long-term viability.
X4= market value of equity / book value of total liabilities. Adds market dimension that can show up security price fluctuation as a possible red flag.
X5= sales / total assets. Standard measure for total asset turnover (varies greatly from industry to industry).
Altman found that the ratio profile for the bankrupt group fell at −0.25 avg, and for the non-bankrupt group at +4.48 avg.
Altman Z-Score was found to be 72% accurate in predicting bankruptcy two years before the event, with a Type II error (false negatives) of 6% (Altman, 1968). In a series of subsequent tests covering three periods over the next 31 years (up until 1999), the model was found to be approximately 80%–90% accurate in predicting bankruptcy one year before the event, with a Type II error (classifying the firm as bankrupt when it does not go bankrupt) of approximately 15%–20% (Altman, 2000).
There was a study conducted on financial data for 12 financially active private manufacturing companies and 12 financially inactive private manufacturing companies in the UK. The entire samples have been chosen and tested in the period of the 12 last years from 2002- 2014. The Altman’s Z Score was measured for 2002 ad 2014 for each of these set of companies. The companies with Altman’s Z Score in distress areas were dissolved and filed for bankruptcy where-as other companies had a significantly high altman’s Z Score. This study shows the best approach to using Altman’s Modified Z-Score is to perform score comparison over the number of years to observe any increase or decrease in Altman’s Z Score. This method has also a number of drawbacks. It must be used carefully as the ideal Z score and distress zone score vary greatly between industry types. For Example Z Score of a Software development company where Capital required is very low compared to a manufacturing company will be different from a Manufacturing company’s Z Score
Beneish M Score
The Beneish Model uses financial ratios of a specific company to determine if the reported earnings have been manipulated. The Beneish Model is calculated using following 8 financial ratios
- Day Sales in receivable index (DSRI) = (Net Receivablest/Salest)/(Net Receivablest-1/Salest-1)
- Gross Margin index (GMI) = [(Salest-1 -Cost of Goods Soldt-1)/Salest-1]/[(Salest -Cost of Goods Soldt)/Salest]
- Asset Quality index (AQI) = [(Current Assetst + PP&Et + Securitiest)/Total Assetst]/ [1 – ((Current Assetst-1 + PP&Et-1 + Securitiest-1) / Total Assetst-1)]
- Sales Growth index (SGI) = Salest / Salest-1
- Depreciation Index (DEPI) = (Depreciationt-1/ (PP&Et-1 + Depreciationt-1)) / (Depreciationt / (PP&Et + Depreciationt))
- Sales General and Administrative Expenses Index (SGAI) = (SG&A Expenset / Salest) / (SG&A Expenset-1 / Salest-1)
- Leverage Index (LVGI) = [(Current Liabilitiest + Total Long Term Debtt) / Total Assetst] / [(Current Liabilitiest-1 + Total Long Term Debtt-1) / Total Assetst-1]
- Total Accruals to Total Assets (TATA) = (Income from Continuing Operationst – Cash Flows from Operationst) / Total Assetst
- M-Score = −4.84 + 0.92 × DSRI + 0.528 × GMI + 0.404 × AQI + 0.892 × SGI + 0.115 × DEPI −0.172 × SGAI + 4.679 × TATA − 0.327 × LVGI
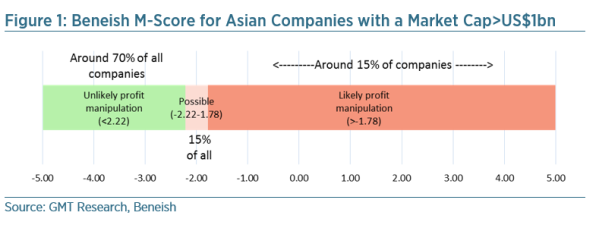
If M-Score is less than -2.22 – the company is unlikely to be a manipulator.
If M-Score is greater than -2.22 – the company is likely to be a manipulator.
These ratios and M score attempts at detecting increase in earnings with no corresponding increase in associated cost.
Combined Algorithm to detect Financial Statement Manipulation
In year 2009 Dr. Igor Pustylnick introduced a slight variation of Altman’s Z Score as P-Score and came up with more accurate method for prediction of financial fraud. Dr Pustylnick used Altman’s formula with slightly different set of input variables as follows
Z=1.2X1 + 1.4X2 + 3.3X3 + 0.6X4 + 1.0X5
X1= working capital / total assets
X2= retained earnings / total assets
X3= EBIT / total assets
X4= market value of equity / book value of total debt
X5= net sales / total assets
P=1.2X1 + 1.4X2 + 3.3X3 + 0.6X4 + 1.0X5
X1= shareholder’s equity / total assets
X2= retained earnings / total assets
X3= EBIT / total assets
X4= market value of equity / book value of total debt
X5= Revenue / total assets
On Plotting these Z Scores and P scores in same graph Dr. Igor noticed that rate of change of P scores were higher that rate of change of Z scores when financial statements were manipulated.
On observing this he created a regression line
(🔺P – 🔺Z) = α + ß1X1 + ß2X2+ ß3X3 + ß4X4
Dr. Igor Pustylnick analyzed several financial statements using this formula and observed high correlation between decrease net income to revenue ratio to difference in rate of change of P and Z scores signifying high risk of financial fraud. However, this method needs to be used only as risk measure and manual audit of data needs to be done to ascertain accuracy.
These are some very good mechanism to detect financial fraud, however these needs to be supported by industry experts, expert auditors so that how manipulators try to comply to standard ratios can be detected using their expert advise and these methods can be fine tuned for better result.
Graph database
Graph databases offer new methods of uncovering fraud rings and other sophisticated scams with a high degree of accuracy, and are capable of stopping advanced fraud scenarios in real time.
Augmenting one’s existing fraud detection infrastructure to support ring detection can be done by running appropriate entity link analysis queries using a graph database, and running checks during key stages in the business transaction lifecycle, such as:
- Listing of shares with stock exchange
- During share transactions
- List of promoters, securities holders
Real time graph traversals tied to the right kinds of events can help agencies identify probable fraud rings.
Discriminant Analysis and Neural Network based on complex event processing
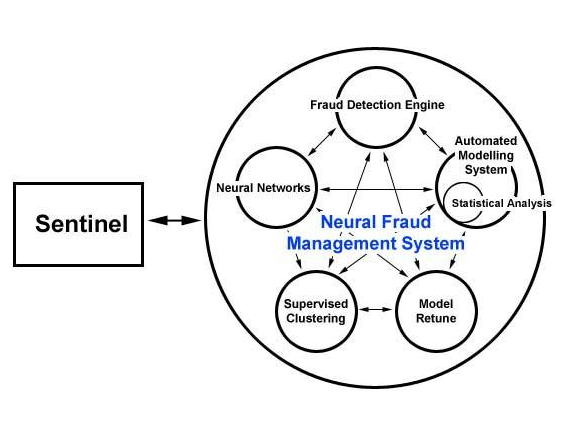
Complex Event Processing Engine creates a event cluster based on known historical fraud and no fraud events. Discriminant function is used to allocate a new event into specific group of events (fraud or no fraud). Neural network is used to improve the accuracy of the discriminant function.
In the next part we will discuss about detection of financial fraud through analysis of financial statements.

